
How to Improve Website Loading Speed Through Design

How to Improve Website Loading Speed Through Design
Want to know the fastest way to tank your conversion rates? Ship a slow website. A large portion of mobile users abandon pages that take longer than a few seconds to load, and every 100ms of improvement correlates with measurable conversion gains. The good news? Most of the biggest wins come from design decisions you can make right now, not months-long backend overhauls.
Here’s your quick-start checklist to improve website loading speed through design:
- Convert all images to WebP or AVIF format and compress photos to quality 75–80% (visually imperceptible, but file sizes drop dramatically)
- Use
srcsetandsizesattributes to serve properly sized images per device (never send a 2000px image to a 375px mobile screen) - Defer or remove non-critical JavaScript, including third-party analytics, chat widgets, and ad scripts
- Deploy a CDN like Cloudflare to cache content at edge servers close to your users
- Preload your hero (LCP) image with
fetchpriority="high"and never lazy-load it - Minify CSS and JavaScript, then load non-critical styles asynchronously
- Set explicit
widthandheighton every image and container to prevent layout shifts and protect your CLS score
That list alone moves most sites from “poor” to “needs improvement” on Core Web Vitals. For a fast user experience, visual content should load within 1 second, input response times should be under 50 milliseconds, and animations should render at 16.7 milliseconds per frame. Now let’s go deeper.
How you can optimize images and media to accelerate page load
Images account for a significant portion of total page weight on most websites. That’s where your biggest wins live.
- Modern formats first: WebP and AVIF formats are significantly smaller than JPEG at equivalent quality, often reducing file size by a large margin. Use a
<picture>element with WebP/AVIF sources and a JPEG fallback for older browsers. - Responsive images: The
srcsetattribute lets browsers pick the right resolution. Serve 400px for mobile, 800px for tablet, 1200px for desktop. Sending desktop-sized images to phones wastes bandwidth on every single visit. - Lazy loading (with one exception): Add
loading="lazy"to all below-the-fold images and videos. The one exception is your LCP image (usually the hero). Lazy loading the LCP element actively hurts your score. - Preload the hero: A single
<link rel="preload" fetchpriority="high">tag on your LCP image can improve LCP by 200–800ms. That’s a huge gain for one line of HTML. - Compression sweet spot: Quality 75–80% for photos is visually imperceptible but reduces file size by 40–60%.
- Font optimization: Use
font-display: swapto prevent invisible text flash, subset fonts to only the characters you actually need (cutting file size from 100KB+ down to 15–20KB), and self-host your fonts instead of pulling from Google Fonts CDN to reduce file load time. Pro Tip: Consider an image CDN like Cloudinary or imgix. These services automatically serve the optimal format, size, and quality based on the requesting device, so you never have to manually manage format negotiation again.
Reducing HTTP requests and managing scripts for faster rendering
Every asset your page loads is a round trip to a server. More trips equal more wait time, and it compounds fast.
- Audit your asset count. Combine files where possible and ruthlessly remove unused CSS and JavaScript. The Chrome DevTools Coverage tab shows you exactly which code is never executed.
- Defer non-critical scripts. Auditing and deferring third-party scripts yields substantially greater performance improvement compared to code minification alone. Analytics, chat widgets, and social embeds can notably add delay to your critical rendering path.
- Async loading for independent scripts. Use
asyncfor analytics and third-party tools that don’t depend on the DOM. Usedeferfor everything else that doesn’t need to run before first paint. - Inline critical CSS. Inlining critical CSS and loading the rest asynchronously eliminates render-blocking styles entirely, which speeds up First Contentful Paint noticeably.
- Conditional loading. WordPress plugins and Shopify apps often load their CSS and JavaScript on every page, even pages where they’re not used. Conditional loading can save 30–60% of unnecessary resource downloads.
- Flatten your DOM. Complex, deeply nested HTML structures slow rendering because the browser has more work to do calculating styles and layout. Advocate for simpler, flatter markup from the wireframe stage.
How caching, CDNs, and hosting choices affect your speed
Infrastructure decisions made outside the design file still show up in your Lighthouse score. Here’s what actually moves the needle.
- Deploy a CDN. A Content Delivery Network caches your content at edge servers worldwide, reducing the physical distance between your users and your assets. Deploying a CDN reduces Time to First Byte significantly for geographically distributed audiences. Cloudflare’s Observatory tool makes it easy to measure the before-and-after impact.
- Browser caching with cache-control headers. Instruct browsers to cache static files so returning visitors don’t re-download assets they already have. This dramatically cuts load times for anyone who visits more than once.
- Brotli compression. Brotli is 15–25% smaller than Gzip for text resources. A 200KB JavaScript file compresses to roughly 40KB with Brotli. Enable it for HTML, CSS, JavaScript, SVG, and JSON.
- Choose fast hosting. Your origin server should respond in under 200ms. If your TTFB consistently exceeds 1.5 seconds, no amount of frontend optimization fully compensates.
- Pre-compress static assets at build time. Generating
.brand.gzfiles during your build process removes the server processing overhead on every request. - Limit redirect chains. Each redirect adds latency to the initial page load. Audit important pages periodically and cut unnecessary hops.
A website performance audit is a practical first step to identify which of these infrastructure gaps is costing you the most.
How to test and monitor your website’s loading performance
You cannot improve what you do not measure with tools like Google Lighthouse. Gut feelings about speed are almost always wrong.
- Google Lighthouse and PageSpeed Insights are your baselines. Run Lighthouse on your top 10–20 pages and record LCP, CLS, INP, TTFB, page weight, and JavaScript size for mobile. Check Google Search Console’s Core Web Vitals report for site-wide patterns.
- Responsiveness targets: Visual content should load within 1 second, idle/input response should be under 50 milliseconds, and animations should render at 16.7 milliseconds per frame for a fast, smooth experience.
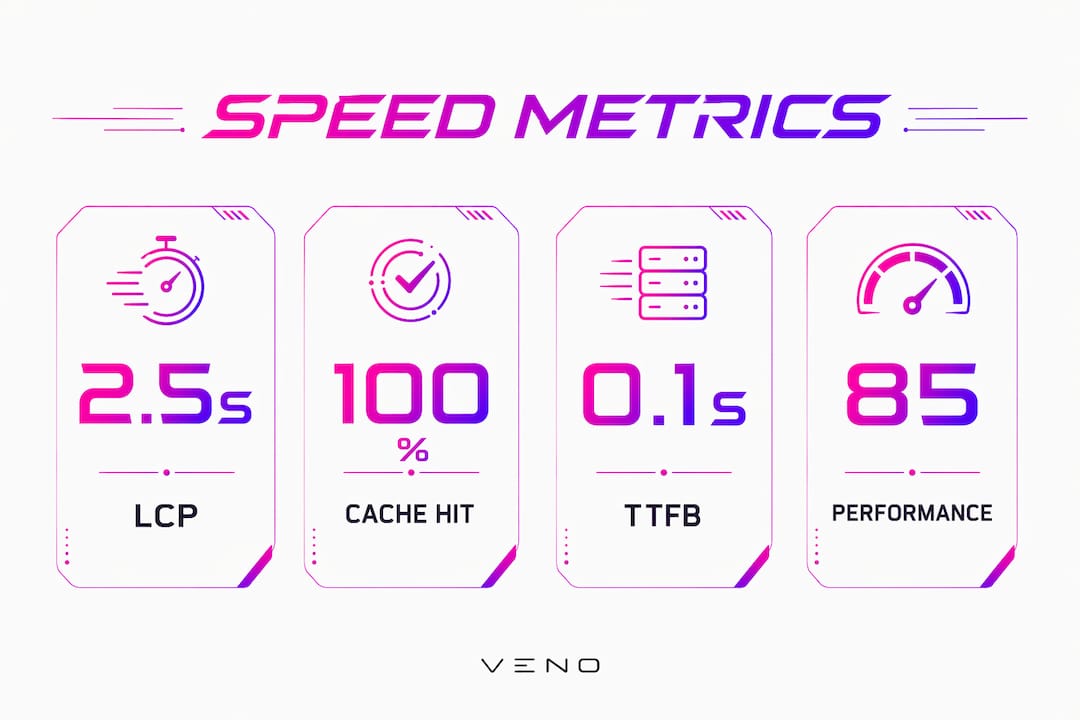
- Core Web Vitals targets: LCP under 2.5 seconds, CLS near 0, and INP under 200ms at the 75th percentile. These are Google’s confirmed ranking signals, not just UX niceties.
- Chrome DevTools gives you granular network request analysis, critical rendering path visualization, and the Coverage tab for unused code. The Performance panel records main thread activity so you can spot Long Tasks blocking interactivity.
- Performance budgets prevent regressions. Set limits on image weight, JavaScript bundle size, and total page weight before development starts, and enforce them in your CI pipeline.
- Test across devices and connections. A page that loads fast on fiber at your desk may crawl on a 4G connection. Throttle CPU and network in DevTools to simulate real-world conditions.
| Metric | Target | Why it matters |
|---|---|---|
| LCP | Under 2.5s | Measures perceived loading speed for the largest visible element |
| CLS | Under 0.1 | Measures visual stability; prevents unexpected layout jumps |
| INP | Under 200ms | Measures responsiveness to user input |
| TTFB | Under 800ms | Measures server response time at the 75th percentile |
| Animations | 16.7ms per frame | Ensures smooth 60fps rendering |
Tracking these metrics across multiple devices gives you a complete picture. You can also explore KPIs and measurement tools to build a more structured monitoring workflow.
Why performance is a core design principle, not a developer’s problem
Here’s a take that might ruffle some feathers: slow websites are usually a design problem first. Every high-resolution image, every custom font weight, every complex animation, every third-party widget added “for engagement” carries a performance cost. Designers make those calls.

Performance budgets established at the wireframe stage prevent unchecked asset growth throughout development. When you define targets like “LCP under 2.5 seconds” in the design brief alongside brand guidelines, speed stops being a technical afterthought and becomes a constraint the whole team designs within.
A mobile-first design approach inherently promotes leaner layouts. Starting with the smallest screen forces you to prioritize content and cut anything that doesn’t earn its place. Media queries then progressively enhance the experience for larger viewports, adding complexity only where it genuinely serves users.
At Coumba Win Design, the approach to startup website layouts balances bold aesthetics with performance by standardizing lightweight, reusable UI components and prioritizing critical content above the fold. The result is sites that look sharp and load fast, not one or the other.
Conduct competitor performance audits early. Run Lighthouse on three or four sites in your space, record their LCP and CLS scores, and use those numbers to set realistic benchmarks for your own project. That context makes performance targets feel concrete rather than arbitrary.
Key Takeaways
Fast-loading websites require design decisions made early, not performance patches applied late.
| Point | Details |
|---|---|
| Images drive most page weight | Images account for 50–70% of total page weight; convert to WebP/AVIF and compress to quality 75–80%. |
| CDNs cut TTFB dramatically | Deploying a CDN reduces Time to First Byte significantly for distributed audiences. |
| Third-party scripts are expensive | Each third-party script can add noticeable latency; deferring them outperforms minification by a large margin. |
| Performance budgets prevent bloat | Setting performance budgets early keeps asset sizes controlled throughout development. |
| LCP preloading is high ROI | Preloading the hero image with fetchpriority="high" can noticeably improve Largest Contentful Paint. |
Ready to build fast and look great doing it?

Speed and bold design aren’t a trade-off. At Coumba Win Design, we build startup websites that load fast, convert well, and actually look like your brand (not a generic template). From performance-first design systems to reusable UI components built for speed, we handle the whole picture. Let’s talk about what your site could actually be.
FAQ
How do you boost website loading speed quickly?
High-return improvements include deploying a CDN, converting images to modern formats, deferring non-critical JavaScript, inlining critical CSS, and auditing third-party scripts; these steps can significantly enhance Core Web Vitals within a typical measurement cycle.
What is the 3-second rule in website design?
A large portion of mobile users abandon pages that take longer than a few seconds to load, making about 3 seconds a widely cited threshold for acceptable mobile load time. Targeting an LCP under 2.5 seconds keeps you safely inside that window.
What makes a website load faster?
The biggest factors are image optimization (format, compression, responsive sizing), CDN deployment, deferred JavaScript, browser caching, and fast hosting with a TTFB under 200ms. Design decisions like font strategy, DOM complexity, and asset budgets also directly affect load speed.
How does design affect website performance?
Every design choice carries a performance cost: image resolution, custom font weights, animations, and third-party widgets all add to page weight and rendering time. Treating performance as a design constraint from the wireframe stage, rather than a developer fix at launch, produces consistently faster sites.
Recommended