TAM SAM SOM Slide: How to Build One Investors Believe
TAM SAM SOM Slide: How to Build One Investors Believe
A good TAM SAM SOM slide does one job: it shows an investor that the market is big enough to matter and that you know which slice you can actually win. TAM is the whole pie, SAM is the part you can serve, and SOM is the part you can realistically grab in the next couple of years. The slide earns trust when the math behind those three numbers is visible and simple, and when the design lets someone get it in a few seconds. (Yes, we have watched founders squint at a five-ring bullseye with tiny footnotes. Let’s not.)
TL;DR
- TAM, SAM and SOM are nested: each is a subset of the one before it, so TAM is always the biggest number and SOM the smallest.
- Build the numbers bottom-up (customers times revenue per customer) and use top-down data only as a sanity check.
- Put one number per category on the slide, in the same units and currency, with the SOM time horizon and two or three key assumptions.
- Keep the proof (sources, spreadsheet, sensitivity cases) in backup slides so the main slide stays clean.
- SOM bigger than SAM, or a “1% of a huge market” claim with no plan, is the fastest way to lose the room.
Table of Contents
- What TAM, SAM and SOM actually mean
- Bottom-up or top-down: pick bottom-up
- A worked example you can copy the logic of
- What the slide itself should show
- Mistakes that cost you credibility
- How to talk through the slide
- Our take: the market slide is a design problem too
- Want the slide to look as sharp as the math?
- FAQ
- Sources
What TAM, SAM and SOM actually mean
TAM is Total Addressable Market: the annual revenue a product would generate if it captured 100% of its market. SAM is Serviceable Addressable Market: the part of TAM you can reach with your current business model, geography and distribution channels. SOM is Serviceable Obtainable Market: the share of SAM you can realistically capture in the near term.
The relationship is nested. TAM is the ceiling, SAM is TAM filtered by what you can serve, and SOM is SAM filtered again by what you can actually win. That is why investors read the three numbers as a story: how big could this get, where are you aiming, and what happens first.
A quick translation for founders who like plain words:
- TAM answers: if everyone who could ever buy did buy, how much money is that?
- SAM answers: given our product, geography, language and channels, who can we sell to today?
- SOM answers: given our team, budget and competition, how much of that will we really close in the next two to three years?
One note on naming. You will see SAM written as “Serviceable Addressable” in some places and “Serviceable Available” in others. Salesforce uses the second wording. Pick one, and use it the same way on the slide and in the deck.
Bottom-up or top-down: pick bottom-up
There are two main ways to get the numbers. Top-down starts with an industry report and narrows it. Bottom-up multiplies the customers you can reach by what each one pays. TechCrunch also describes a third, value theory, an educated analysis used mostly for brand-new categories.
For a pitch, bottom-up wins. Y Combinator’s Michael Seibel says he prefers bottom-up because it keeps founders from the classic top-down pitfall of not narrowing the customer enough. Andreessen Horowitz likes it because it accounts for the target customer, their willingness to pay and how you will market and sell, and it also warns against gaming the TAM number when pitching investors.
The basic bottom-up formulas, as Stripe lays them out:
- TAM = total number of potential customers × annual revenue per customer
- SAM = number of potential customers you can serve × annual revenue per customer
- SOM = number of customers you can realistically win × annual revenue per customer
Where to get the customer counts
For U.S. markets, start with government data. VentureBeat’s market-size guide points to the U.S. Census as the best resource for company counts by industry, revenue and employee count. It also flags a common slip: citing 28 million U.S. businesses when 22 million of them have no employees. If you sell to companies with payroll, that distinction cuts your count by a fifth before you have done anything else.
Stripe also points U.S. founders to the Small Business Administration’s list of public data sources. For revenue per customer, use your real price or annual contract value. If you have no customers yet, use the price you will actually charge, not a hopeful average.
Where audiences come in
If you sell to a reachable audience (a media product, a consumer app, a marketplace), SAM depends on who you can actually target and monetize. Understanding audience targeting basics helps you decide which segments belong in SAM and which are just wishful thinking.
Use top-down as a sanity check
Top-down still has a job. It shows the category is big enough to be worth an investor’s time, while bottom-up shows the opportunity is real. If the two land within the same ballpark, you are in good shape. If they differ by an order of magnitude, one of them is wrong, and it is usually the one you built in a hurry.
A worked example you can copy the logic of
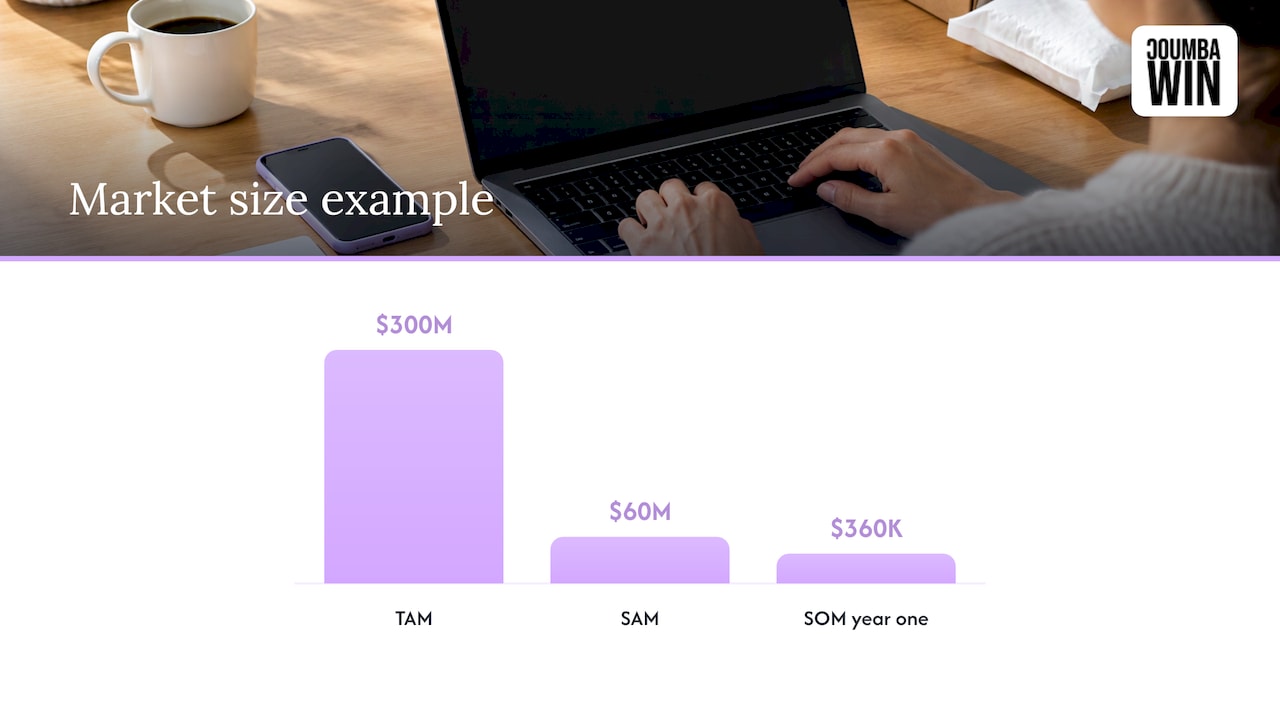
Stripe’s example is clean enough to borrow. A SaaS company sells appointment scheduling software to veterinary clinics at $3,000 per year. Here is how the numbers stack up:
| Layer | Assumption | Math | Result |
|---|---|---|---|
| TAM | 100,000 veterinary clinics worldwide | 100,000 × $3,000 | $300 million |
| SAM | 20,000 independent clinics in the U.S. and Canada | 20,000 × $3,000 | $60 million |
| SOM (year one) | 120 clinics won by two salespeople | 120 × $3,000 | $360,000 (0.6% of SAM) |
Notice what makes this believable. Each step has a reason: the product is English-only, support covers only the U.S. and Canada, and the software is designed for independent clinics. The SOM is tied to sales capacity (two salespeople), not to a vague percentage.
That last point matters. For SOM, Stripe suggests basing it on capacity: how many deals your salespeople can close in a year, or your marketing budget divided by customer acquisition cost. Carta frames it the same way: if 10% of U.S. public schools might be interested but you can reasonably expect to capture only 0.1%, your SOM is that 0.1%.
A second flavor: top-down with filters
The University of Regina’s market-size guide runs a U.S. healthcare example through percentage filters: 8 million adults with a clinical indication, a 10% segment (800,000 people), a $1,000 monthly price. That gives a TAM of $9.6 billion a year. It then applies a 20% filter for SAM ($1.92 billion) and takes SOM at 15% of TAM ($288 million). It is a good illustration of the mechanics, though most early-stage investors will want your SOM grounded in capacity rather than a flat percentage.
TechCrunch’s olives-and-peppers example shows a category-based version: the U.S. specialty foods space as TAM, plant-based foods as a $7 billion SAM, and a $2.5 billion product category as SOM. For year-by-year SOM, it suggests 0.5% share in year one, 1% in year two and 3% in year three, backed by a bottom-up count of stores you expect to sell to (75, then 200, then 500).
What the slide itself should show
Now the part that decides whether anyone remembers your market slide. Your calculation lives in a spreadsheet. The slide is the headline version.
VentureBeat’s advice is blunt: include sources and calculations, because a thorough bottom-up spreadsheet shows how you got the figure and gives investors confidence. In practice, here is a layout that works:
- One headline that makes the point. Something like “A $60M market we can serve today, with a path to $300M.” Not “Market Size.”
- Three numbers, one per category. TAM, SAM, SOM, in the same units and currency. No ranges, no “$5 to $50 billion.”
- A visual that shows nesting. Concentric circles, a funnel or three stacked bars. Pick one and keep it clean.
- The SOM time horizon. “Year one” or “24 months.” A SOM without a date is just a number.
- Two or three assumptions in small, readable text. “Independent clinics only,” “U.S. and Canada,” “$3,000 annual contract.”
- A source line. The Census table, the report, your own pricing. Name it.
A useful test: could someone who has never heard of your company read the slide across a conference table and explain it back to you in one sentence? If not, there is too much on it.
Keep the math in the appendix
The cleanest decks put the main slide up front and the proof in backup slides: an assumption table, the detailed calculations, a source list and a couple of sensitivity cases (what if we win half as many customers?). When an investor asks “where does that SAM come from?”, you flip to the backup instead of talking your way through it. Our own pitch deck outline walks through how a 10 to 15 slide deck handles that appendix.
Design details that help
- Big numbers, small words. The figure is the hero. Labels should be short enough to read without leaning in.
- Consistent color logic. Darkest for SOM (your focus), lighter for SAM and TAM, so the eye lands on the number you can act on.
- Avoid chart screenshots. Pasting a tiny-font chart from a research report forces the room to squint. Redraw it with your own numbers.
- No eight-slice pie charts. If a chart needs a legend to be understood, it needs a redesign.
If you build decks in Microsoft PowerPoint, these Microsoft PowerPoint guides can help with the mechanics of shapes, alignment and layout. The design decisions (what to show, what to cut) are the harder part.
Mistakes that cost you credibility
Investors have seen a thousand of these slides, so the same errors jump out. Stripe lists five to avoid: defining the category too broadly, assuming a small share of a big market without saying how you will win customers, confusing TAM with SAM, relying on unsupported assumptions, and showing a SOM that has no link to sales capacity, marketing budget or hiring plan.
A few more worth taping to your monitor:
- Treating TAM as revenue you will earn. HubSpot’s list includes treating TAM as achievable revenue, using an unvalidated percentage for SOM, ignoring market constraints, and mixing timeframes or using outdated data.
- The “$1 trillion market” opener. A big number with no calculation is a claim, not evidence. NextView Ventures argues that an unexplained billion-dollar market figure can hurt credibility, and that showing the calculation, plus the adjacent markets you could expand into, is more convincing.
- Inconsistent math. SOM bigger than SAM, or SAM bigger than TAM, tells an investor nobody checked the slide.
- Mixing sources without saying why. A TAM from one analyst firm, a SAM from another and a SOM from your gut reads as patchwork.
- Gaming TAM. A16z notes that many of the best internet companies, eBay and Airbnb among them, started by addressing what looked like modest markets. A smaller, honest TAM with a believable growth path beats an inflated one.
Market-size errors often travel with design errors: cluttered slides, buried numbers, too much text. We cover those in pitch deck design mistakes that cost founders meetings.
How to talk through the slide
The slide is a prop. You are the explanation. A simple spoken flow takes under a minute:
- Define the market in one sentence (TAM). Say where the number comes from.
- Show focus (SAM): the segment, geography or channel you start with, and why.
- Land realism (SOM): what you will win by when, and what limits it (sales capacity, budget, hiring).
- Pivot to execution: “Here is how we get those first customers.” Move to your go-to-market slide.
Expect three follow-ups: where the TAM figure comes from, which assumptions shrink TAM to SAM, and what caps SOM over the next two to three years. Have those answers ready in your appendix.
At Series A, the market slide often sits alongside hard traction numbers, and the order of the deck shifts. We broke that down in putting traction on slide 2.
Our take: the market slide is a design problem too
Here is what we see founders underestimate: the math can be perfect and the slide can still fail. A market slide is the moment an investor decides whether you think clearly. If the three numbers are buried under a decorative graphic, that decision goes the wrong way before you have said a word.
That is why we treat the market slide as a strategic design job, not a formatting pass. Our approach to pitch decks is custom and built with the founder, not poured into a generic layout, and it is designed to put the one number that matters in front of the room. Pitch deadlines do not wait, so we also focus on fast turnaround when you need a deck for an event or a meeting.
Our advice: do the bottom-up work, decide your three numbers and your two or three assumptions, and then let design carry the story. The founder’s job is the thinking. Ours is making that thinking impossible to miss.
Coumba Evelyn
Want the slide to look as sharp as the math?
Coumba Win designs pitch decks for startups, including the market-size slide, as part of a custom, founder-collaborative process that rejects generic templates and AI-generated design. If your numbers are ready and you need a deck that shows them clearly, take a look at our pitch deck design and other services.

If the deck is part of a bigger launch, we also handle web design, UI and UX, and graphic and print design, so your site and your slides tell the same story.
FAQ
What is a realistic SOM for a startup?
Tie it to capacity: the deals your team can close or the customers your budget can acquire in a set period, usually 24 months or less. Stripe’s method uses sales headcount or marketing budget divided by customer acquisition cost. The result is often a fraction of one percent of SAM in year one, as in the veterinary example, where 120 clinics equal 0.6% of SAM.
Should I use top-down or bottom-up numbers on the slide?
Lead with bottom-up, because it shows you understand your customer and price. Use top-down to show the category is large. If you present both, make sure they roughly agree, and explain any gap.
How many numbers should the slide have?
One per category: a single TAM, a single SAM and a single SOM, in the same currency and time frame. Add the SOM horizon and two or three assumptions. Everything else (inputs, sources, sensitivity cases) goes in backup slides.
Where can I find market data for a U.S. startup?
The U.S. Census has company counts by industry, revenue and employee size, and VentureBeat calls it the best resource for U.S. market data. The Small Business Administration also lists public data sources. For a quick check on how this fits the rest of your deck, see our investor one pager guide.
Is a bigger TAM always better?
No. A huge TAM with a vague path to it makes investors skeptical. A clearly defined, honestly sized market with a believable SOM reads as stronger thinking.
Sources
- TAM, SAM, and SOM: How to Size Your Market | Stripe
- TAM SAM SOM: What It Means and How to Calculate | Amazon Ads
- TAM, SAM, and SOM: Made Simple for Growing Businesses | Salesforce
- How to calculate your startup’s TAM, SAM and SOM | TechCrunch
- How to Pitch Your Company | Y Combinator
- 16 More Startup Metrics | Andreessen Horowitz
- 10 tips for acing your market-size slide | VentureBeat
- Market size: TAM, SAM, & SOM | Carta
- How to Calculate Market Size | University of Regina
- TAM, SAM & SOM: What Do They Mean & How Do You Calculate | HubSpot
- You Can’t Judge Market Size by This Slide | NextView
- Audience targeting explained
- Microsoft PowerPoint guides